In this project I was able to take dog and cat sounds and build a classifier for them. I will explain what I did in 2 posts, 1. spectrograms of the sounds and 2. technical details of how I analyzed the sounds. I have posted the data and some Ipython/jupyter notebooks for this project in a repo on github. Feel free to use my code for some of your own exploration.
In this project, I obtained a corpus of cat and dog vocalizations from the all mighty kaggle https://www.kaggle.com/mmoreaux/audio-cats-and-dogs
I used the numpy, scipy, librosa and sklearn libraries heavily for the audio and modeling of this project.
Below is a video of my very talkative cat, George. He is a Burmese (15 years old!) and I love him. I recorded him meowing and then added him to our corpus of cat sounds. Below the video is a representation of his meow.

raw audio signal for george's meow

spectrogram of george's meow
PRETTY!!!
Plotted above is the raw wavform of the meow (using amplitude (Root Mean Squared)) vs. time and below that is the spectrogram.
In order to understand what is goinng on with the spectrogram, let's go over some Fourier analysis. All sounds (in nature) are complex waves. These waves can be created by adding together a LOT of sinusoids (simpler waves) at different frequencies(number of bumps in the sinusoids, basically what you hear as pitch) (see the dark figure below). Because all sounds are comprised of different sinusoids, we can also do the reverse and extract the different sinusoids or frequencies that make up a sound. When we do this and plot it we call this a spectrogram.
We get the spectrogram by sampling (snipping) the sound a bunch of times and then plotting the power (yellow color=more power) of each (log) frequency on the y-axis and time is on the x-axis, like in the raw wave file above it. We get this by computing the Short Time Fourier Transform (STFT) with a window size of 1024.
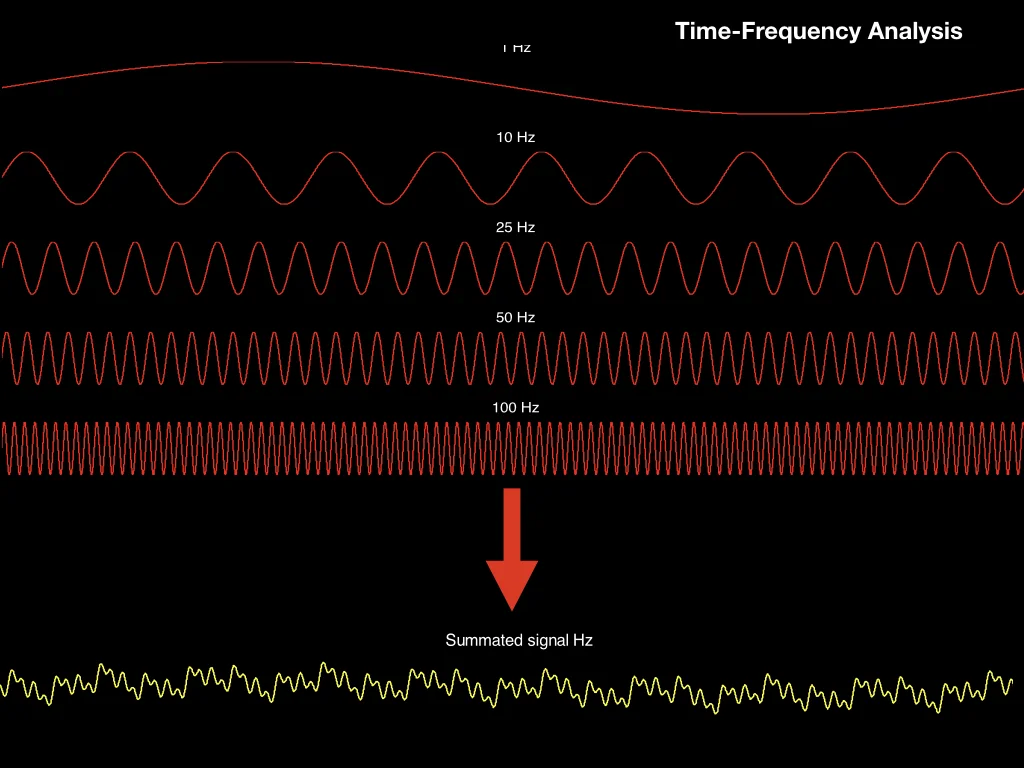
Complex signals are comprised of many simpler sinusoids
Unfortunately, George's lovely meow isn't the best representation of the structure, so I'll give you a few more to look at.

an angry kitty's meow
Here, we see a really clear representation of the harmonics in this angry kitty's meowing. You can even follow along as his pitch goes down at the end of each meow.
Try to figure out what the next one is, before you play it.

cat
The one above, is 2 meows, followed by some serious purring. purrrrrrrrrrrr When I saw this I knew that this classification task would need to rely on more than just cats = high frequencies vs. dogs = low frequencies. Look at all the energy in those low freqs! Let's compare this with some dog spectrograms.

dog barking
Next, let's look at some really high pitched dogs, barking very rapidly. These guys are really up there in the frequency range, which again, prevents us from just saying cats are high and dogs are low.

dogs
Below is a nice dog howl. In this one we can see that there is also some structure in the dog's that is similar, though not exactly, like the cats.

There are actually several clips with purring and howling which brings me to the data clean up part.
For reasons that I can't explain, I listened to almost all of these files (they are only a few seconds each), and was glad I did because there are several (21 files) that were both cats and dogs, had music in the background, were just noise with no animal sounds, were so compressed that they were barely intelligible, were manipulated to sound like music(?) or were clearly a human meowing. So, I considered this my initial clean up. This left me with 149 cat .wav files and 108 dog .wav files.
See part 2 for a more technical post about how I reduced the dimensions for the classification models.